
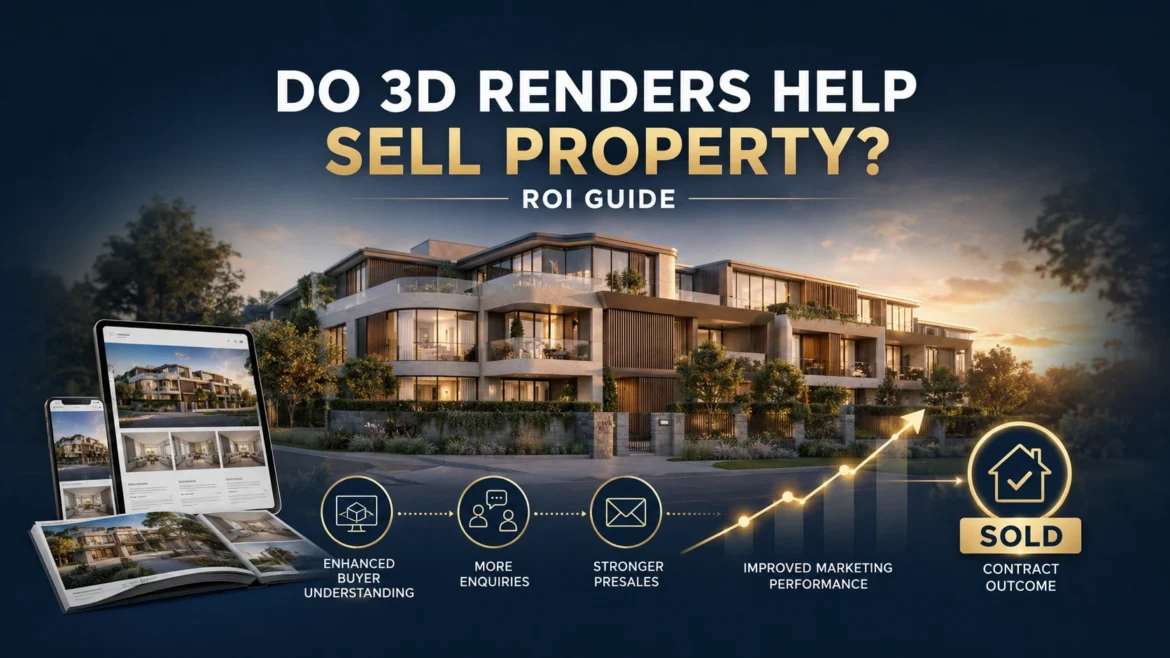
Do 3D Renders Help Sell Property? ROI Guide
PROPERTY MARKETING · ATTRIBUTION · VISUALISATION ROI
Do 3D Renders Help Sell Property? A Practical ROI Measurement Guide
A practical framework for developers and marketing teams to measure how architectural visualisation contributes to attention, enquiry quality, presales communication and stakeholder decisions—without claiming it caused the sale alone.
- ROI framework
- Attribution limits
- Lead-quality signals
- Measurement brief
Quick answer
Do 3D renders actually help sell property?
3D renders can support a property sale by making an unbuilt design easier to understand, giving campaigns usable visual assets and helping buyers or stakeholders evaluate the proposal. They do not independently prove demand, price acceptance or sales causation.
Measure contribution at several levels: whether the assets were used as planned, whether people engaged with render-led creative, whether enquiries understood the product, whether sales conversations became clearer and whether stakeholder decisions moved faster. Revenue remains the final business outcome, but location, product, price, media, sales execution, finance conditions and timing also influence it. Treat renders as one measurable input within that system.
Build a measurable render briefProject teams we have supported
Who we have worked with








In this guide
Measure contribution, not creative preference
Ten signals that reveal whether 3D renders are helping
No single metric proves visualisation ROI. Use a chain of delivery, engagement, enquiry, sales and decision signals that connects each render to a defined campaign job.
-
01
Asset utilisation
Track whether the commissioned views actually appear across the website, portals, brochures, signage, presentations, advertising and sales tools named in the brief.
-
02
Creative engagement
Compare click-through rate, video completion, carousel interaction, landing-page engagement or view-through behaviour for render-led creative against relevant alternatives.
-
03
Landing-page behaviour
Review scroll depth, gallery opens, floor-plan views, brochure downloads, return visits and CTA interaction after visitors encounter the visual assets.
-
04
Enquiry volume
Track qualified form submissions, calls, appointments and registration events, but separate genuine project interest from spam, duplicate or low-intent leads.
-
05
Enquiry quality
Ask whether prospects understand the property type, layout, finish, outlook, amenities and price position before the sales team repeats basic explanations.
-
06
Sales-tool adoption
Measure whether agents use the renders in calls, appointments and follow-ups, and which views repeatedly help answer objections or explain unbuilt spaces.
-
07
Decision speed
Record whether investors, planning stakeholders, design teams or buyers reach defined decisions with fewer clarification rounds after reviewing the visuals.
-
08
Cost avoidance
Capture prevented reshoots, reduced layout rework, fewer duplicated assets and earlier identification of communication gaps—not only extra revenue.
-
09
Milestone conversion
Connect campaigns to registrations, appointments, reservations, deposits, leasing discussions or approvals while keeping each milestone distinct from a completed sale.
-
10
Revenue contribution
Where CRM data permits, report influenced pipeline or sales from contacts exposed to render-led campaigns, with clear attribution rules and appropriate caveats.
Build a measurable evidence chain
What should property teams measure at each stage?
Start with the render’s immediate job, then connect it to the next observable behaviour. The further a metric sits from the asset, the more other variables influence the result.
| Stage | Useful signal | Where to track it | Attribution caution |
|---|---|---|---|
| Asset delivery | Views, crops and formats delivered and used as planned | Asset register, media plan and channel audit | Delivery alone proves production completion, not market impact |
| Attention | Impressions, viewability, click-through, gallery opens and video completion | Advertising platforms, analytics and heatmaps | Creative, targeting, placement and media spend all affect attention |
| Understanding | Fewer basic questions, stronger recall and clearer product comprehension | Sales notes, surveys, user tests and appointment feedback | Use structured questions; anecdotes alone can overstate the effect |
| Lead progress | Qualified enquiries, appointments, brochure downloads and registrations | CRM, call tracking, forms and campaign parameters | Do not treat every form fill as an equal-quality opportunity |
| Commercial outcome | Reservations, deposits, influenced pipeline, leases or completed sales | CRM, sales reporting and finance records | Price, product, location, finance and sales execution also influence revenue |
Define the tracking plan before production. Use the property-marketing render specification guide to align each asset with its channel, ratio, dimensions and final file requirements.
Three levels of evidence
Choose an ROI method that matches the decision
A small campaign does not need enterprise attribution, but every project needs a baseline, a defined outcome and honest limits.
Before-and-after review
Compare a similar period before and after render-led assets launch when traffic sources, offer and spend are reasonably stable.
- Fast and accessible
- Good for smaller campaigns
- Needs a documented baseline
- Cannot isolate causation
Campaign and CRM attribution
Tag render-led placements, connect interactions to leads and compare enquiry quality, milestones and influenced pipeline by campaign.
- Channel-level visibility
- Lead-quality comparison
- Sales feedback included
- Requires clean tracking
Controlled creative test
Compare render-led and alternative creative while holding audience, placement, offer, budget and timing as consistent as practical.
- Predefined success metric
- Sufficient sample and duration
- One main variable changed
- Commercial follow-through tracked
Different projects create different returns
Where can architectural renders create measurable value?
Off-plan residential
Measure registrations, appointments, brochure engagement and whether prospects understand facade, interiors, outlook, amenity and lifestyle before construction is complete.
Visualisation for architectsHouse-and-land and communities
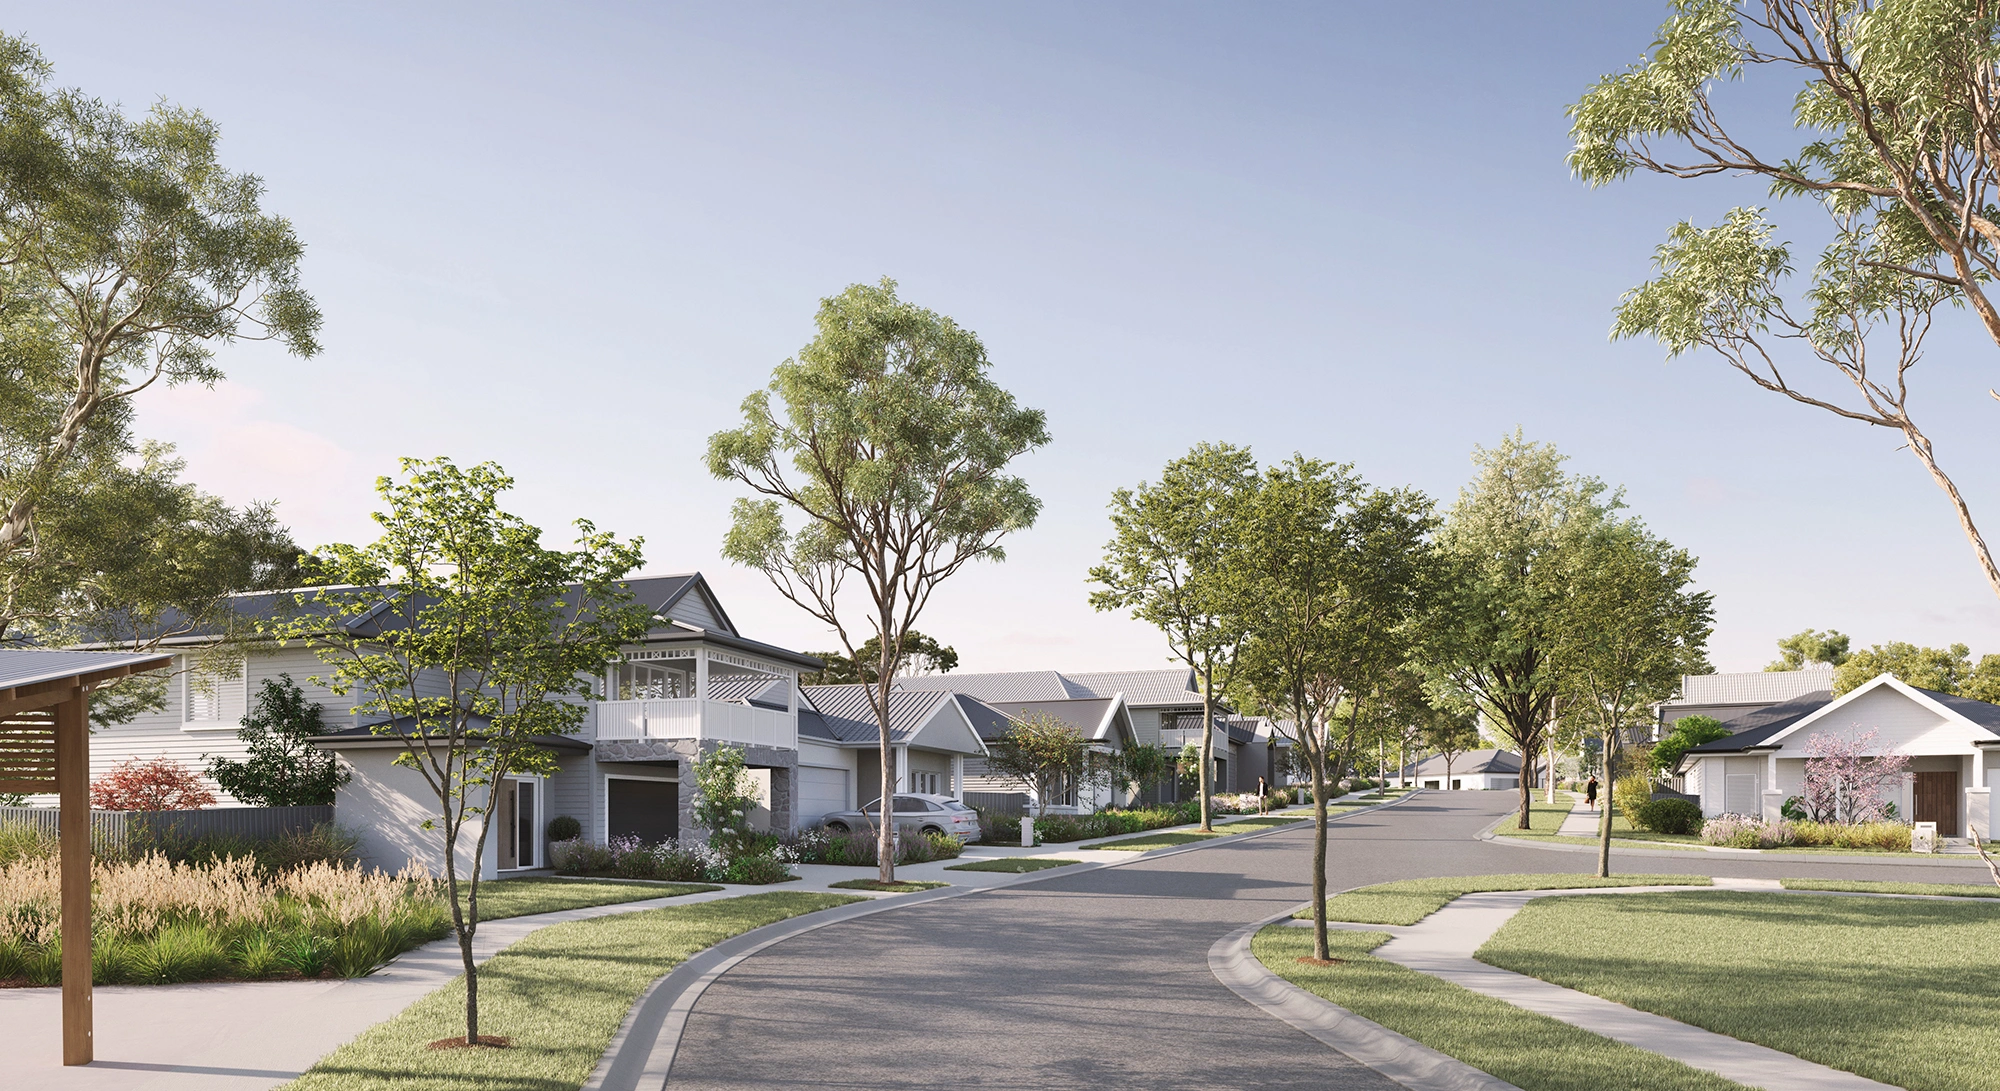
Track how streetscapes, facade choices, landscape and community visuals support lot enquiries, display appointments, option discussions and buyer comprehension.
Rendering for property developersCommercial and mixed use
Connect visual assets to leasing enquiries, tenant presentations, investor discussions and clearer communication of frontage, access, lobby, tenancy and precinct activity.
Plan final output specificationsPlanning and stakeholder review
Value may appear as fewer clarification cycles, faster option comparison, stronger presentation comprehension or earlier agreement—not direct property sales.
View architectural rendering workDefine measurement before production
A six-step architectural visualisation ROI workflow
- 01
Name the business decision
Define what the campaign must improve: product understanding, creative attention, enquiry quality, appointment conversion, stakeholder approval or sales progress.
- 02
Assign each asset a job
Map every exterior, interior, aerial, floor plan or animation to its audience, channel, placement and intended communication outcome.
- 03
Record a baseline
Capture current traffic, engagement, lead quality, repeated buyer questions, sales milestones and decision timelines before the new assets launch.
- 04
Implement clean tracking
Use consistent campaign parameters, CTA events, call tracking, form sources, asset naming and CRM stages so evidence survives channel hand-offs.
- 05
Review quality and outcomes
Combine analytics with sales-team feedback and lead-quality review; a higher click rate can still produce weaker commercial conversations.
- 06
Reuse the learning
Document which view, message, format and channel performed its job, then use that evidence to plan the next asset rather than repeating every deliverable.
Measurement-brief checklist
What should a measurable render brief include?
Give the studio and marketing team enough information to connect production decisions to actual campaign use.
See the project-file checklist- Business objective, audience and property-development stage
- Named job for every proposed view and visual format
- Website, portal, advertising, print and presentation placements
- Existing performance baseline and primary success signal
- Required landscape, square, portrait, mobile and print outputs
- Tracking owner, sales-feedback owner and reporting date
Recent campaign-ready visualisation work
Different views solve different communication problems.
An interior can explain spatial connection and finish; a facade can establish architectural identity; a streetscape can communicate context and scale; a landscape view can show community amenity. ROI improves when the campaign commissions complementary information rather than repeating the same message. Select any image to enlarge it.

Completed project · Wollert, Victoria
936 Kendon Drive exterior rendering
This completed exterior demonstrates a useful visualisation outcome without pretending to prove a sale. The image makes building form, facade rhythm, material contrast, glazing, planting and street relationship available before construction photography exists. Its commercial contribution would be measured by where the asset was used, how prospects engaged with it, which questions it helped answer and what qualified milestones followed.
- Asset job
- Explain the proposed exterior, streetscape presence, material hierarchy and landscape relationship in one frame.
- Immediate value
- The project team gains a consistent hero asset for presentations, digital campaigns, print and sales conversations.
- Useful evidence
- Track placements, engagement, enquiry comprehension, agent usage and progress through named campaign milestones.
- Attribution limit
- The image can influence understanding and interest; it cannot independently prove that visualisation caused a commercial outcome.
Avoid false precision
Six mistakes that weaken 3D rendering ROI measurement
Claiming the render caused the sale
Exposure and conversion may be related, but property, price, location, media, sales execution, finance and timing remain competing explanations.
Reporting vanity metrics alone
Impressions and likes show distribution or attention; they do not reveal whether prospects understood the project or became qualified opportunities.
Launching without a baseline
Without earlier engagement, enquiry-quality or sales-stage data, the team cannot tell whether the new creative changed normal performance.
Changing every variable together
A new offer, audience, budget, landing page and render launched at once make it difficult to identify which change contributed to the result.
Ignoring lead quality
More form fills can conceal poor-fit, duplicate or low-intent enquiries. Review qualification and milestone progression, not volume alone.
Stopping measurement too early
Property sales cycles can outlast the first campaign report. Preserve source data and review later appointments, reservations or sales outcomes.
Use the strongest claim the evidence can support. “Render-led creative produced more qualified appointments in this controlled campaign” is more useful—and more credible—than “3D rendering increased sales” when the data cannot isolate causation.
Frequently asked questions
3D rendering ROI FAQs
Short answers for developers, architects and marketing teams measuring the contribution of property visualisation.
Do 3D renders help sell property?
They can help buyers understand an unbuilt property, support campaign creative and improve sales conversations. They do not sell property by themselves; product, price, location, media, market conditions and sales execution also influence the outcome.
How can developers measure 3D rendering ROI?
Define each asset’s campaign job, record a baseline and track utilisation, engagement, enquiry quality, sales-tool adoption, decision speed and commercial milestones. Compare costs with measurable contribution while stating attribution limits.
What metrics should property marketing teams track?
Useful metrics include asset usage, click-through rate, gallery interaction, landing-page engagement, qualified enquiries, appointments, prospect comprehension, sales-stage progression, agent feedback and influenced pipeline.
Can 3D renders be credited for a completed sale?
Usually not on their own. A render may influence attention, understanding and sales conversations, but completed sales also depend on price, product, location, finance, media, timing and sales execution. Report contribution rather than unsupported causation.
How should a before-and-after comparison be set up?
Use comparable periods, document traffic sources, spend, offer and campaign changes, and compare both engagement and qualified outcomes. Treat the result as directional evidence when other variables cannot be held constant.
Is a controlled creative test better than a before-and-after review?
It usually provides stronger evidence because the audience, placement, offer, budget and timing can be kept more consistent while one main creative variable changes. It still requires sufficient sample, duration and clean tracking.
What counts as value when the project is not selling property?
For planning, design, investor or stakeholder work, value may appear as clearer option comparison, fewer clarification rounds, faster approvals, stronger presentations or earlier identification of communication and design issues.
What should be included in a measurable architectural-rendering brief?
Include the business objective, audience, project stage, job for every asset, planned placements, output ratios, existing baseline, primary success signal, tracking owner, sales-feedback owner and reporting date.
Request a measurable render scope
What decision should each visual asset improve?
Share the project stage, drawings, audience, campaign channels, repeated buyer questions, planned tracking and deadline. 3D Space Design can recommend the views, formats, crops, review stages and output specifications needed for a focused campaign scope.
- Quote response within 24 hours
- Up to three revision cycles within the agreed scope
- NDA and confidential-project support
- Defined asset jobs, inputs, outputs and measurement signals
PROJECT ENQUIRY
Tell us about your property campaign
Include the project type, campaign objective, required views, placements, audience, success signal, deadline and available drawing or model files.